首先在你的项目中输出一个phpinfo()
将其全部复制下来,然后粘贴到这个网站,点击分析,它就会给你步骤
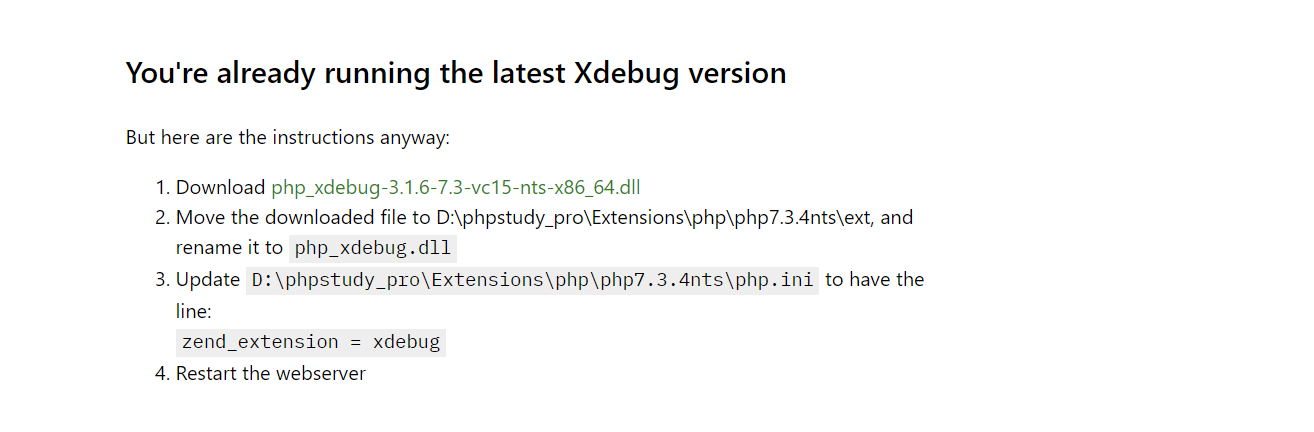
先按照这里面的步骤弄
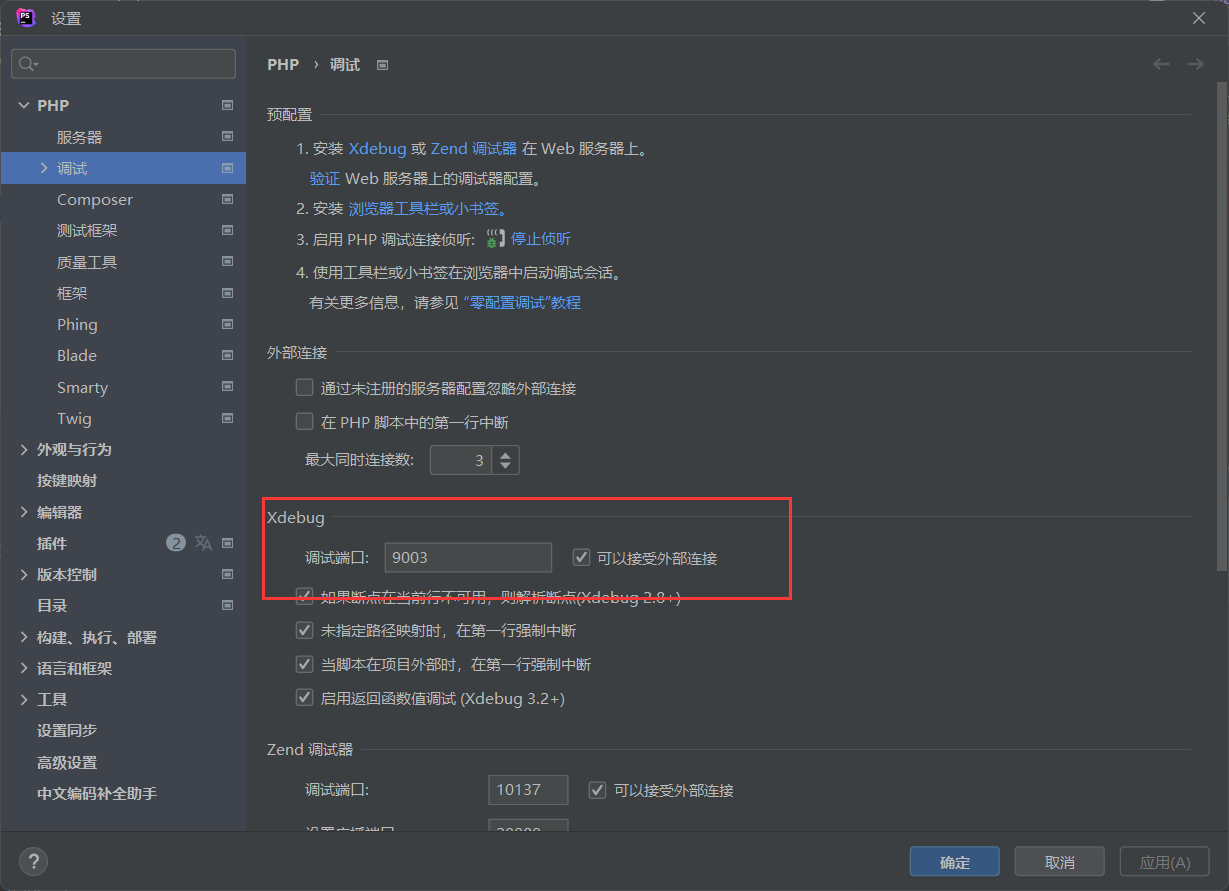
Xdebug配置
1
2
3
4
5
6
7
8
9
10
11
12
13
14
15
16
17
| [Xdebug]
zend_extension=D:/phpstudy_pro/Extensions/php/php7.3.4nts/ext/php_xdebug.dll
xdebug.collect_params=1
xdebug.collect_return=1
xdebug.auto_trace=On
xdebug.trace_output_dir=D:/phpstudy_pro/Extensions/php_log/php7.3.4nts.xdebug.trace
xdebug.profiler_enable=On
xdebug.profiler_output_dir ="D:\phpstudy_pro\Extensions\tmp\xdebug"
xdebug.remote_enable=On
xdebug.remote_host=localhost
xdebug.remote_port=9003
xdebug.mode=debug
xdebug.remote_handler=dbgp
xdebug.remote_autostart=1
xdebug.remote_enable=On
xdebug.remote_autostart = on
xdebug.idekey="PHPSTORM"
|
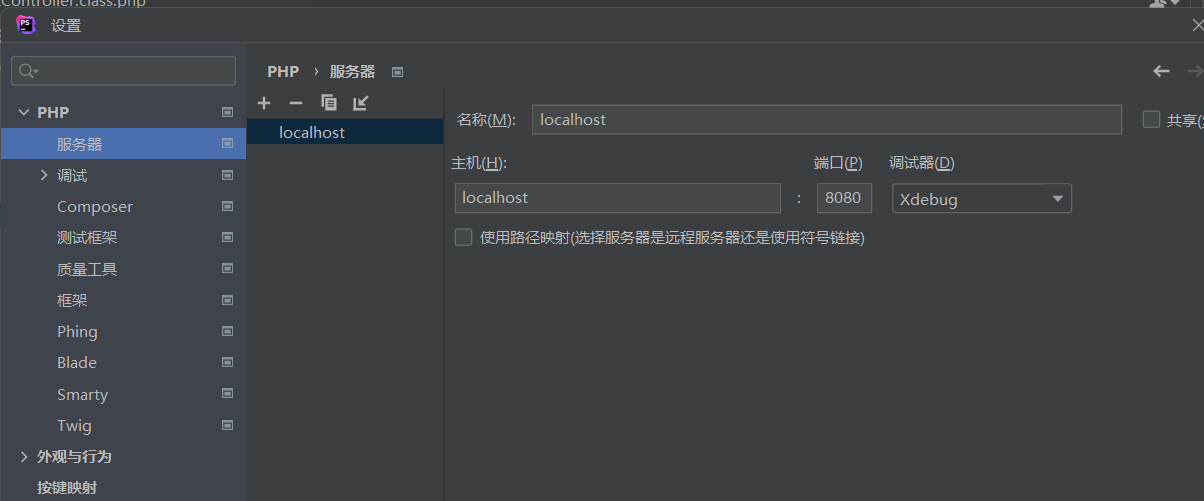
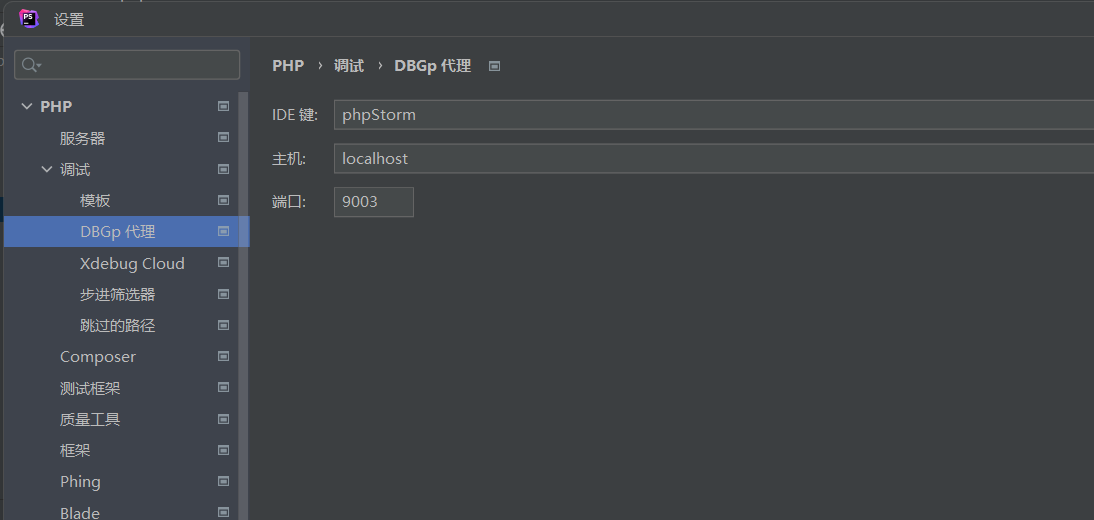
phpstorm配置
下面这个是你服务器的ip和端口
启动配置
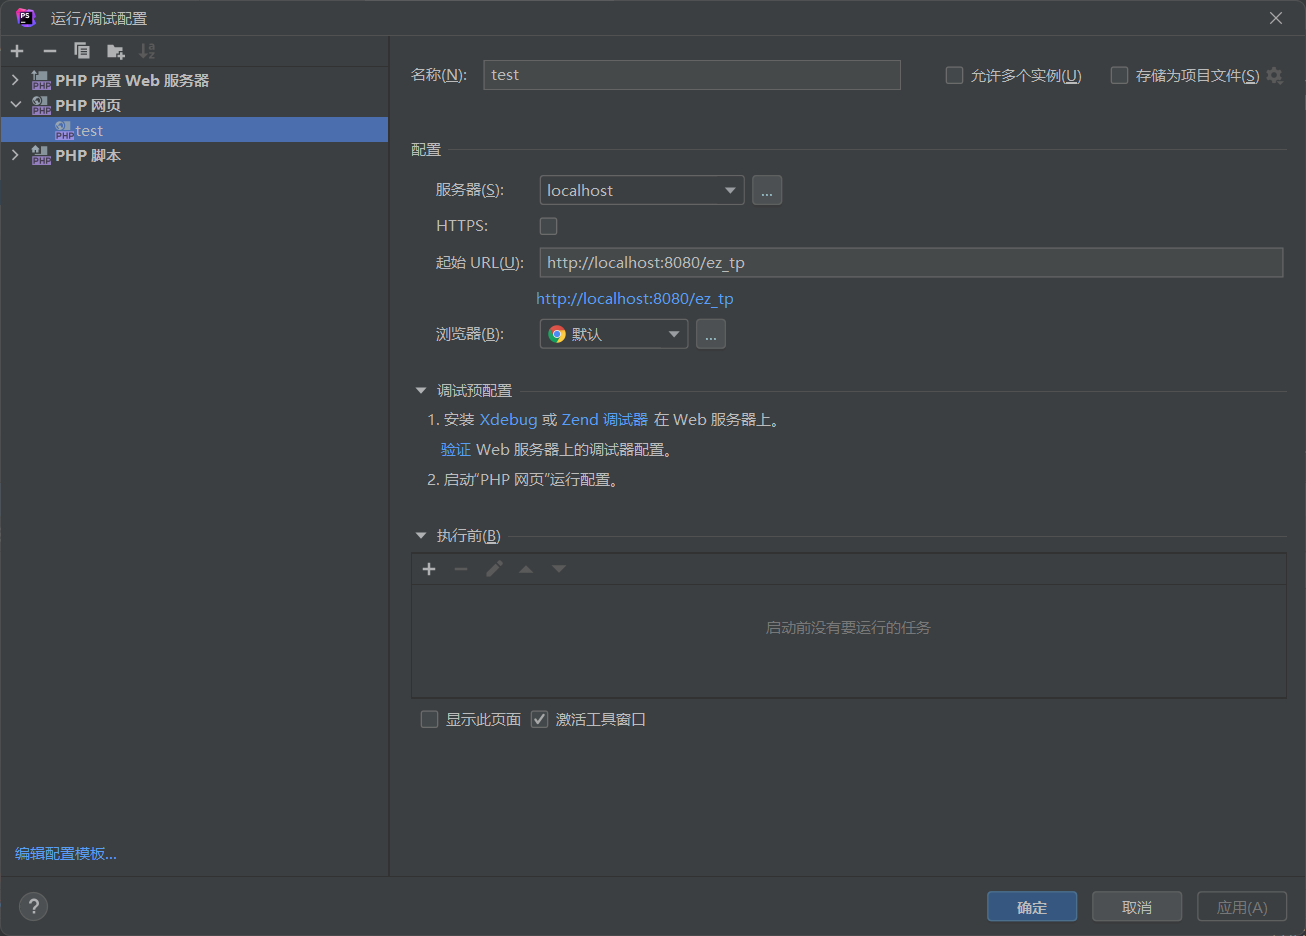
ez_tp是我的项目名称
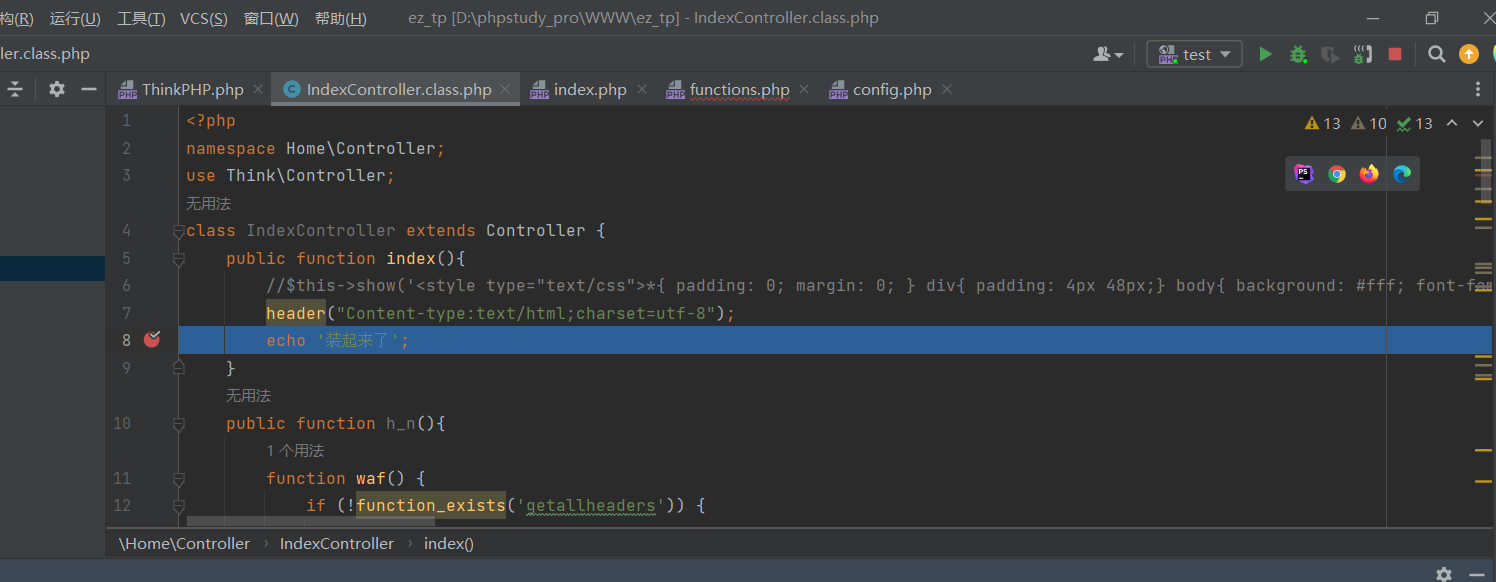
然后在你想调试的地方下个断点,并点击
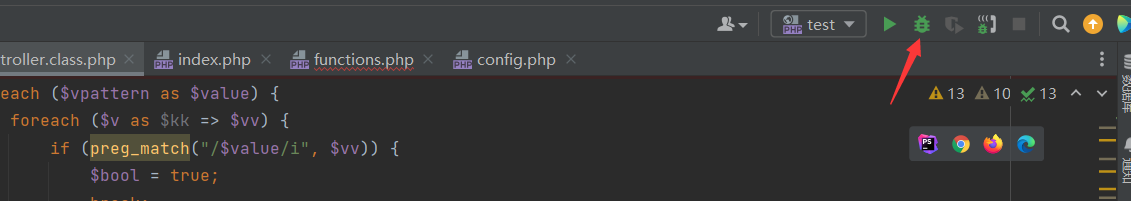
侦听也要开启,就是那个电话图标
Windows权限维持
Polar2024夏季赛-java题目
© 2024 ycxlo
Powered by Hexo & NexT.Muse